Projects
Projects
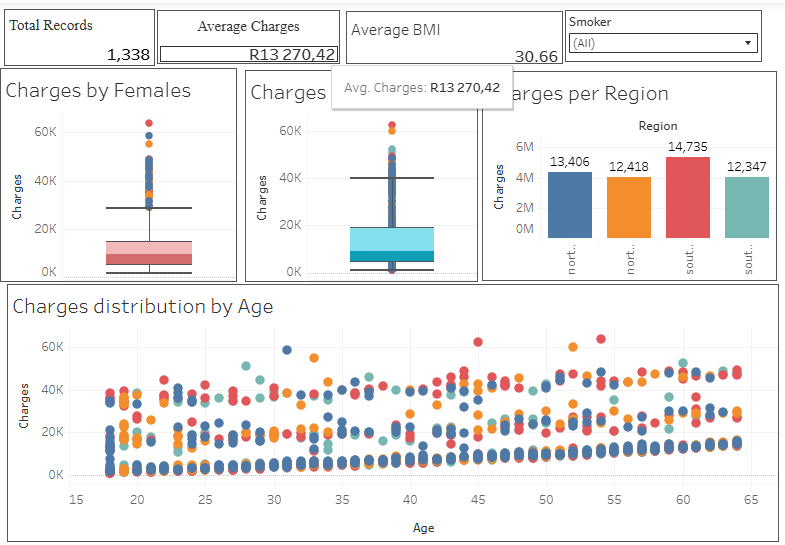
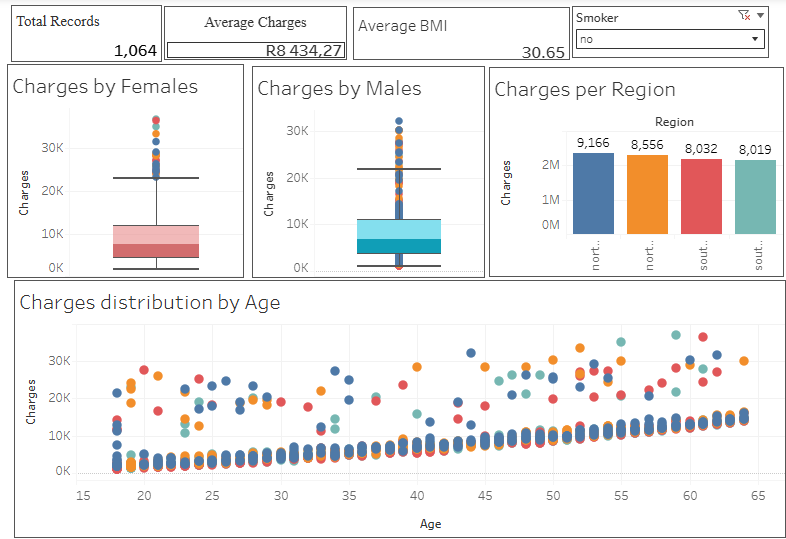
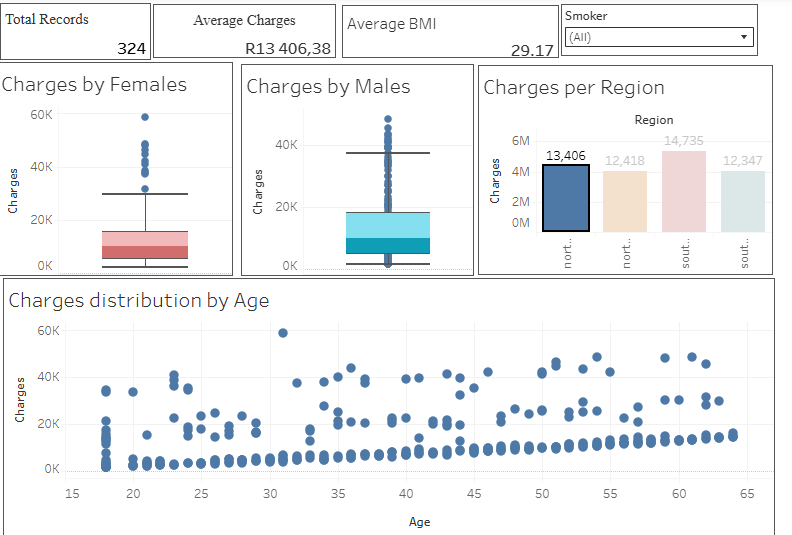
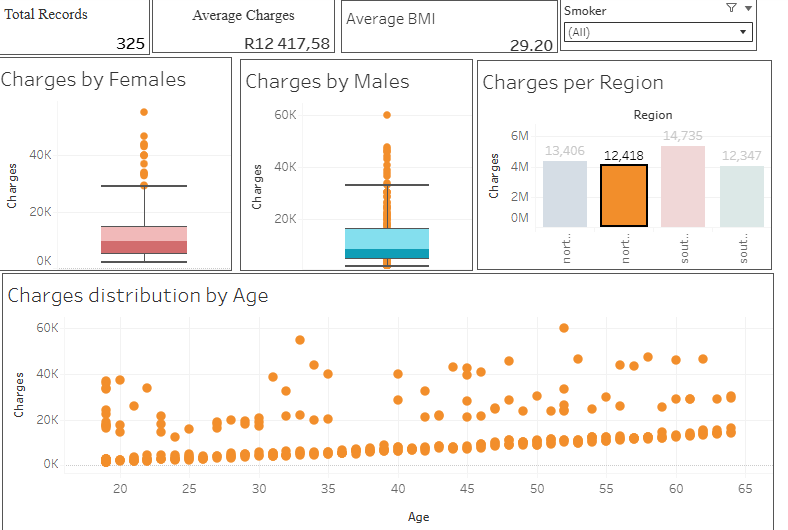
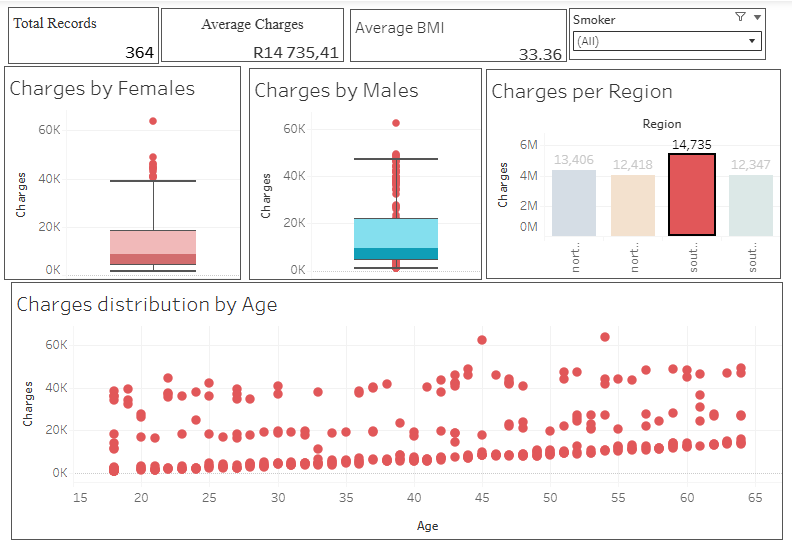
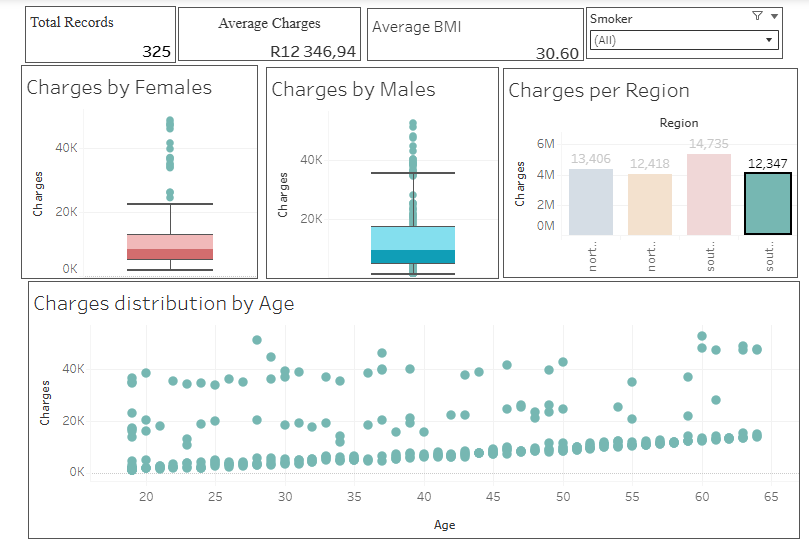
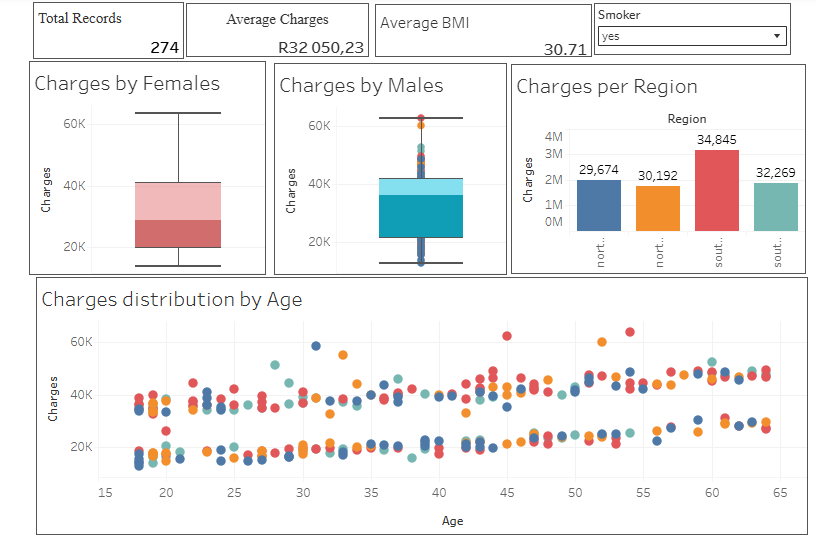
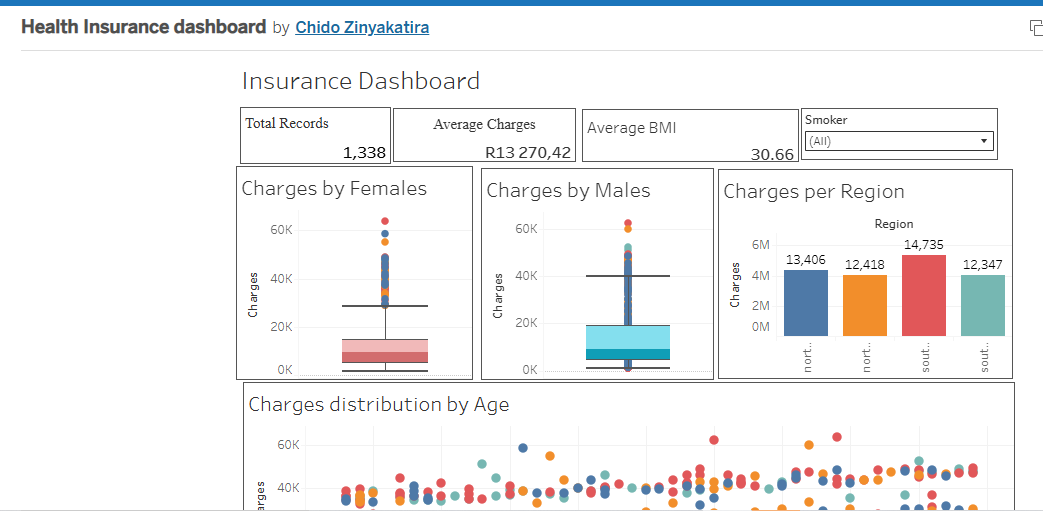
Insurance Risk Analysis Dashboard
Tools: Tableau, R, Statistical Analysis Run EDA and hypothesis testing in R and created an interactive dashboard analyzing insurance premium data to identify key demographic risk factors affecting policy pricing.
Key Achievements: -Analyzed 1338 insurance records -Identified high-risk customer segements -Provided actionable recommendations for premium pricing -Improved risk assessment accuracy through statistical modeling
Here is a visual walkthrough of my tableau Dashboard
Project Files
| View R Script | |
| View Dashboard | Github Repository |
Customer Segmentation Dashboard
Tools: Tableau, R
Overview
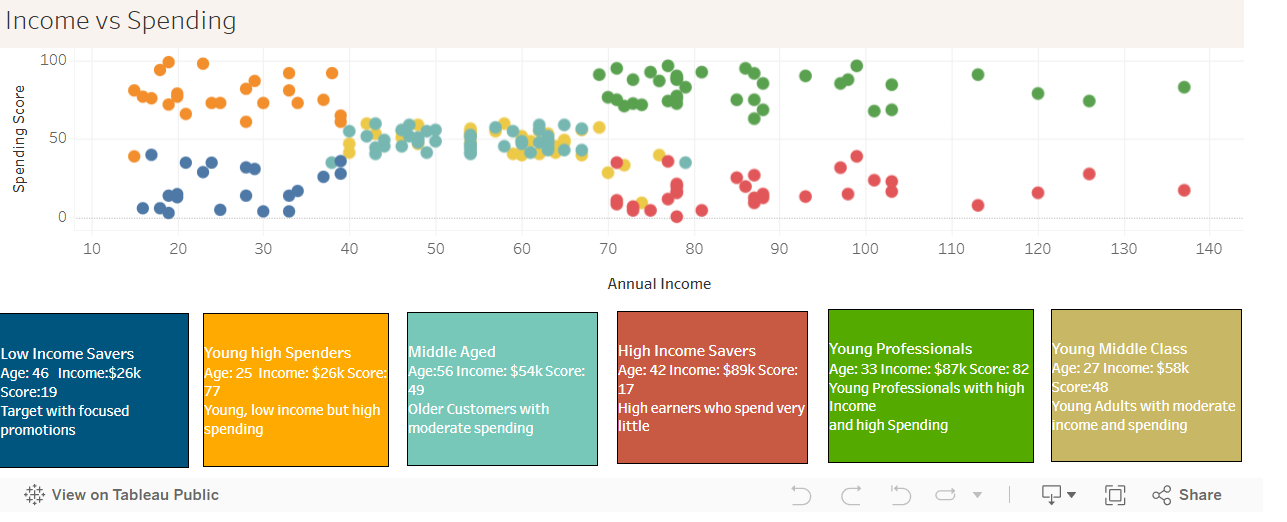
K-Means clustering analysis to identify distinct customer segments based on spending score
Key findings
-Identified 6 distinct customer clusters -Premium Young Professionals show highest spending potential
Dashboard Features
-Interactive scatter plot visualization -Cluster specific insights
- Gender based spending analysis
- Summary with key metrics
Screenshots
Here is a visual walkthrough of my tableau Dashboard

Project Files
Programming Language Popularity forecast
tools: Python
Overview
This project analyzes and forecasts the popularity trends of three major programming languages: C++, Java, and Python using time series forecasting techniques. The analysis employs SARIMA (Seasinal Autoregressive Integrated Moving Average) modeling to predict future popularity bases on historical data patterns.
Key Methodology
Data Preprocessing: Stationarity tests using Adfuller tests and data transformation
Seasonal Decomposition: Breaking downtime series into trend, seasonal, and residual components.
Model Selection: SARIMA(1,1,1)(1,1,1,52) was chosen for C++ and Python and SARIMA(2,1,1)(1,1,1,52) for Java bases on model diagonostics and performance metrics.
Validation: An analysis of residuals was conducted
Accuracy: Comparison of 12-week forecasts against actual observed values
Appropriateness of Model Chosen
Appropriateness of chosen forecasting method Python From the plot of fitted data , i see the model captures both the general trend and seasonal fluctuations effectively, the strong alignment between actual and fitted values indicates the model parameters are well calibrated
The plot of residuals shows that residuals fluctuate around zero throughout time period, indicating no systematic bias, The residuals appear to have relatively constant variance
The acf of residuals are approximately shows most values falling the confidence bands, This indicates the residuals are approximately white noise, confirming the model has adequately captured the temporal dependencies
Java From the plot of fitted data, we see that the fitted values track the original Java data
The residuals fluctuate randomly around zero, this supports model adequacy and suggests the SARIMA model has captured the underlying structure
The acf of residuals shows that there is no significant autocorrelation in residuals, this confirms that the model has adequately the temporal dependencies
model diagonistics support the chosen specification, ACF analysis validates the absence of remaining autocorrelation.
C++ The residual analysis plot shows values oscillating around zero with no clear, indicating good model fit
ACF of residuals: the autocorrelation values fall within confidence bands, confirming residuals are approximately white noise
The fitted vs actual comparison shows the model captures both trend and seasonal variations well
Project Files
Online Retail Country Revenue Analysis (Hadoop & R)
Project Overview This project analyzes sales data from a UK-based online retail company (2009–2011) to evaluate revenue performance across countries. The goal is to support strategic international market expansion decisions using distributed data processing.
Dataset
Source: UCI / Kaggle Online Retail II Dataset
Records include invoice numbers, product codes, quantities, prices, and country of shipment.
Technologies Used
Hadoop (HDFS)
MapReduce (R)
R (data processing & visualization)
ggplot2
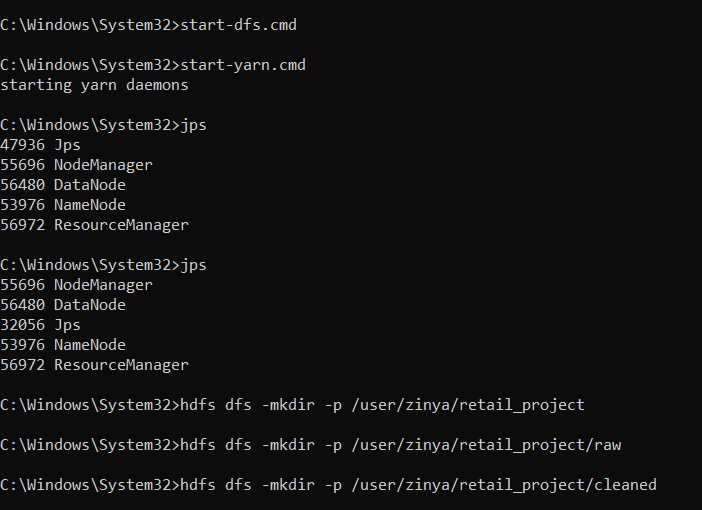
Methodology
Loaded raw transactional data into HDFS.
Cleaned data by removing:
Records with null country values
Records with non-positive quantities
Implemented a MapReduce job in R to compute total revenue per country.
Sorted results in descending order to identify top markets.
Visualized the top 5 countries by revenue using a bar chart.
Key Insights
Revenue is highly concentrated in a small number of European countries.
Top-performing markets represent strong candidates for further investment.
Lower-performing countries may require targeted marketing or operational review.
Business Value This analysis demonstrates how distributed computing can support data-driven international expansion strategies in retail.
Screenshots
Project Files
View my clean data File View my mapper File View my Reducer File View my visualisation File
Product Demand Categorisation Using Hive
Objective To classify products based on demand levels using distributed SQL analytics in Hive, supporting inventory and supply chain decision-making.
Approach
Loaded cleaned transactional data into Hive using an external table schema.
Calculated total quantity sold per product using Hive aggregation queries.
Developed a custom Hive UDF to categorise products into:
High Demand
Medium Demand
Low Demand
Business Value
High-demand products can be prioritised for restocking.
Medium-demand products can be supported through targeted promotions.
Low-demand products can be reviewed for discontinuation or bundling strategies.
Key Skills Demonstrated
Hive DDL & querying
User Defined Functions (UDFs)
Big data analytics
Inventory strategy support
View my project File
Customer Feedback Text Pattern Analysis (Pig & Hive)
Project Overview This project analyzes customer review text from Amazon products to uncover recurring complaint patterns and satisfaction drivers. The analysis focuses on identifying frequently occurring keywords in non-neutral reviews to support product and customer experience improvements.
Dataset
Source: Amazon Product Review Sample (Kaggle)
Fields include review title, review text, product name, and star rating.
Technologies Used
Hadoop (HDFS)
Apache Pig
Hive
Methodology
Loaded raw review data into HDFS.
Used Apache Pig to extract review titles and filter out neutral reviews (rating = 3).
Tokenised review titles and computed word frequencies to identify common themes.
Loaded processed outputs into Hive and created a view of the top 10 most frequent words.
Key Insights
Frequently occurring terms highlight common customer pain points such as product quality, packaging, or usability.
Text pattern analysis provides scalable insight into customer sentiment without manual review.
Business Value This approach enables marketing and product teams to prioritise improvements based on real customer feedback trends, improving satisfaction and reducing returns.
Project Files
View my filtered reviews pig file View my filtered reviews output file View my word frequency output file View my project File
Customer Retention Modelling with PostgreSQL and MADlib
Project Overview This project builds a customer churn prediction model for a telecom provider using PostgreSQL and MADlib. The objective is to predict customer churn using in-database machine learning and translate results into actionable retention strategies.
Dataset
Source: Telco Customer Churn Dataset (Kaggle)
Features include customer demographics, account details, service usage, and churn status.
Technologies Used
PostgreSQL
MADlib
Logistic Regression
Methodology
Imported raw churn data into PostgreSQL and created a cleaned analytical table.
Trained a logistic regression model using MADlib with tenure, contract type, and monthly charges as predictors.
Evaluated model performance using accuracy metrics and confusion matrix queries.
Interpreted model coefficients to identify churn drivers.
Key Insights
Short-tenure customers on flexible contracts exhibit higher churn risk.
Higher monthly charges are associated with increased likelihood of churn.
Long-term contracts significantly reduce churn probability.
Business Value This approach enables scalable, database-native churn prediction, allowing analysts to update models and generate predictions directly on live customer data.
View my filtered reviews pig file
Forecasting Monthly Tourist Arrivals Using SARIMA
Project Overview This project forecasts monthly tourist arrivals for SafariVista Lodge using time series methods to support operational planning. The analysis compares Holt-Winters and SARIMA models to determine the most suitable forecasting approach for strongly seasonal tourism data.
Dataset
Monthly tourist arrivals from January 2001 to December 2020
Variables: Date, Number of Visits
Methodology
Parsed and indexed time series data.
Performed seasonal decomposition to identify trend and recurring seasonal patterns.
Implemented Holt-Winters (Triple Exponential Smoothing) as a baseline model.
Tested for stationarity and fitted a Seasonal ARIMA (SARIMA) model.
Compared models using forecast accuracy metrics and residual diagnostics.
Generated 12-month forecasts for operational planning.
Key Findings
The data exhibits strong annual seasonality and a non-stationary trend.
Holt-Winters captures seasonality but underperforms during structural changes.
SARIMA provides superior forecast accuracy and better residual diagnostics, making it more suitable for this dataset.
Business Value The SARIMA forecasts enable improved staffing schedules, supply ordering, and activity planning by anticipating seasonal fluctuations in tourist demand
Stock Market Volatility Forecasting Using ARCH and GARCH
Project Overview This project models and forecasts stock return volatility for EduNext Technologies using ARCH and GARCH models. The objective is to quantify market risk and support risk-adjusted investment decisions under market uncertainty.
Dataset
Daily stock prices including open, close, high, low, and trading volume
Log returns computed from closing prices
Methodology
Tested stock prices for random walk behaviour and detrended the series where required.
Transformed prices into log returns to ensure stationarity.
Tested for ARCH effects to detect time-varying volatility.
Fitted ARCH(1) and ARCH(2) models to capture short-term volatility dependence.
Implemented GARCH(1,1) to model persistent volatility clustering.
Evaluated models using Ljung–Box and Engle ARCH diagnostics.
Key Findings
Stock returns exhibit volatility clustering, a hallmark of financial time series.
ARCH models capture short-term variance dynamics but decay too quickly.
GARCH(1,1) outperforms ARCH models by capturing long-run volatility persistence.
Business Value Accurate volatility forecasts enable better risk management, pricing of financial instruments, and informed investment strategy decisions.
Course Recommendation System Using NLP and Machine Learning
Project Overview This project develops a text-based course recommender system that suggests suitable career paths based on a learner’s written narrative. The system leverages natural language processing and machine learning to align user interests with relevant course categories.
Dataset
Career and course descriptions
Labeled course categories
Technologies Used
Python
NLP (text preprocessing, TF-IDF)
Scikit-learn
Machine Learning classifiers
Cosine Similarity
Methodology
Cleaned and denoised raw text data using standard NLP preprocessing techniques.
Transformed textual data into numerical features using TF-IDF vectorization.
Addressed class imbalance using resampling techniques.
Trained multiple ML models using 5-fold cross-validation.
Evaluated models using accuracy, precision, recall, and F1-score.
Selected the best-performing model based on F1-score.
Implemented a cosine similarity-based recommender to suggest the top 10 relevant courses from user input.
Key Findings
Proper text preprocessing significantly improves classification performance.
Balancing datasets improves recall for underrepresented course categories.
Cosine similarity effectively matches learner narratives to relevant career paths.
Business Value This system enables scalable, data-driven career guidance, supporting learners in making informed education investment decisions.
News Topic Modelling Using Web Scraping and NLP
Project Overview This project analyses trending news topics by scraping articles from News24 and applying natural language processing and topic modelling techniques. The objective is to identify latent themes in current news coverage and understand topic distributions across articles.
Dataset
Ten scraped News24 articles
Fields: article ID, title, raw content, cleaned content, sentiment polarity
Technologies Used
Python
Web scraping (BeautifulSoup / Requests)
NLP (text preprocessing, sentiment analysis)
TF & TF-IDF
Latent Dirichlet Allocation (LDA)
pyLDAvis
Methodology
Scraped news article URLs and built a structured dataset.
Cleaned and denoised article text and computed sentiment polarity.
Performed term frequency analysis and generated word clouds.
Built TF-IDF matrices to identify salient terms.
Applied LDA topic modelling to extract four dominant topics.
Visualised topic distributions and relationships using pyLDAvis.
Key Insights
Topic modelling reveals dominant themes such as politics, economy, crime, and social issues.
TF-IDF highlights distinctive vocabulary separating topics.
pyLDAvis improves interpretability of topic overlap and salience.
Business Value This analysis enables media organisations to track trending topics, guide editorial focus, and support content strategy using automated text analytics.